Report Based on 311 Services of New York , Collected from NYC OpenData Source
Categories
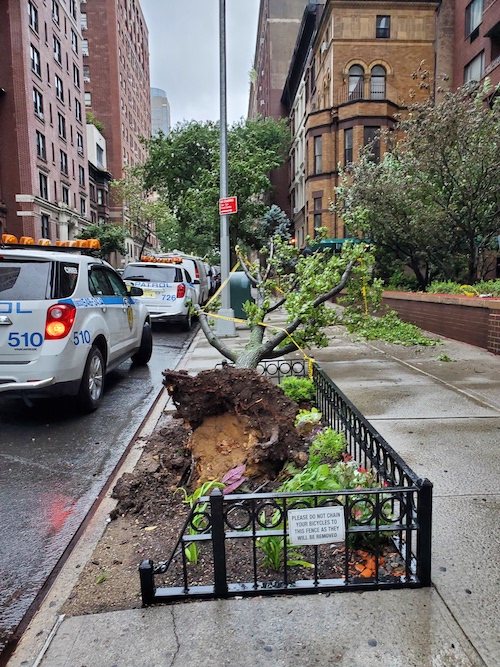
Damaged Tree Report
Report Based on 311 Services of New York , Collected from NYC OpenData Source
In New York City Photo Courtesy- Tourism Guides NYC Coming from abroad and growing up in a very different atmosphere than New York City, I was always fascinated by everything New York had to offer. The tall buildings, city lights, and eccentric performances. The city will fill everyone with a sense of joy despite the […]
Hello, This is my first visualization of the Course DATA 73000. Here, I have used the data from UN Populations Estimates Dataset. We see how the population has changed over the regions from 1950 to 2015. There is a filter on the chart to navigate through the years.
Before the pandemic, it was very common for me to go dine in a restaurant than order food online. I have realized the pandemic got me into a habit of ordering food online or picking up food from any restaurant. Even though it’s easier to order food online, it has its consequences. Sometimes it is […]
Welcome to CUNY Academic Commons. This is your first post. Edit or delete it, then start blogging!